x86 Architecture Overview
Disclaimer: This post contains my personal notes and methodology for the respective TryHackMe room. All the credits for the room and the lab environment go to the original creators at TryHackMe. Flags are not revealed to preserve the challenge for others.
Objective
To learn some basics of x86 CPU and Memory architecture, before diving in deeper into x86 malware analysis.
Basics
- A CPU is made up of Registers, Arithmetic Logic Unit and Control Unit
- Control Unit gets instructions from Main Memory (RAM)
- Address to the next instruction is stored in a register called Instruction Pointer.
- In 32-bit systems: EIP (Extended Instruction Pointer)
- In 64-bit systems: RIP (Register Instruction Pointer).
- Register are much smaller than RAM, but are extremely fast and close to the CPU, and are used to store important data or recurring data.
Registers Overview
- As mentioned, the address to the next instruction is contained within the instruction pointer. Also called Program Counter.
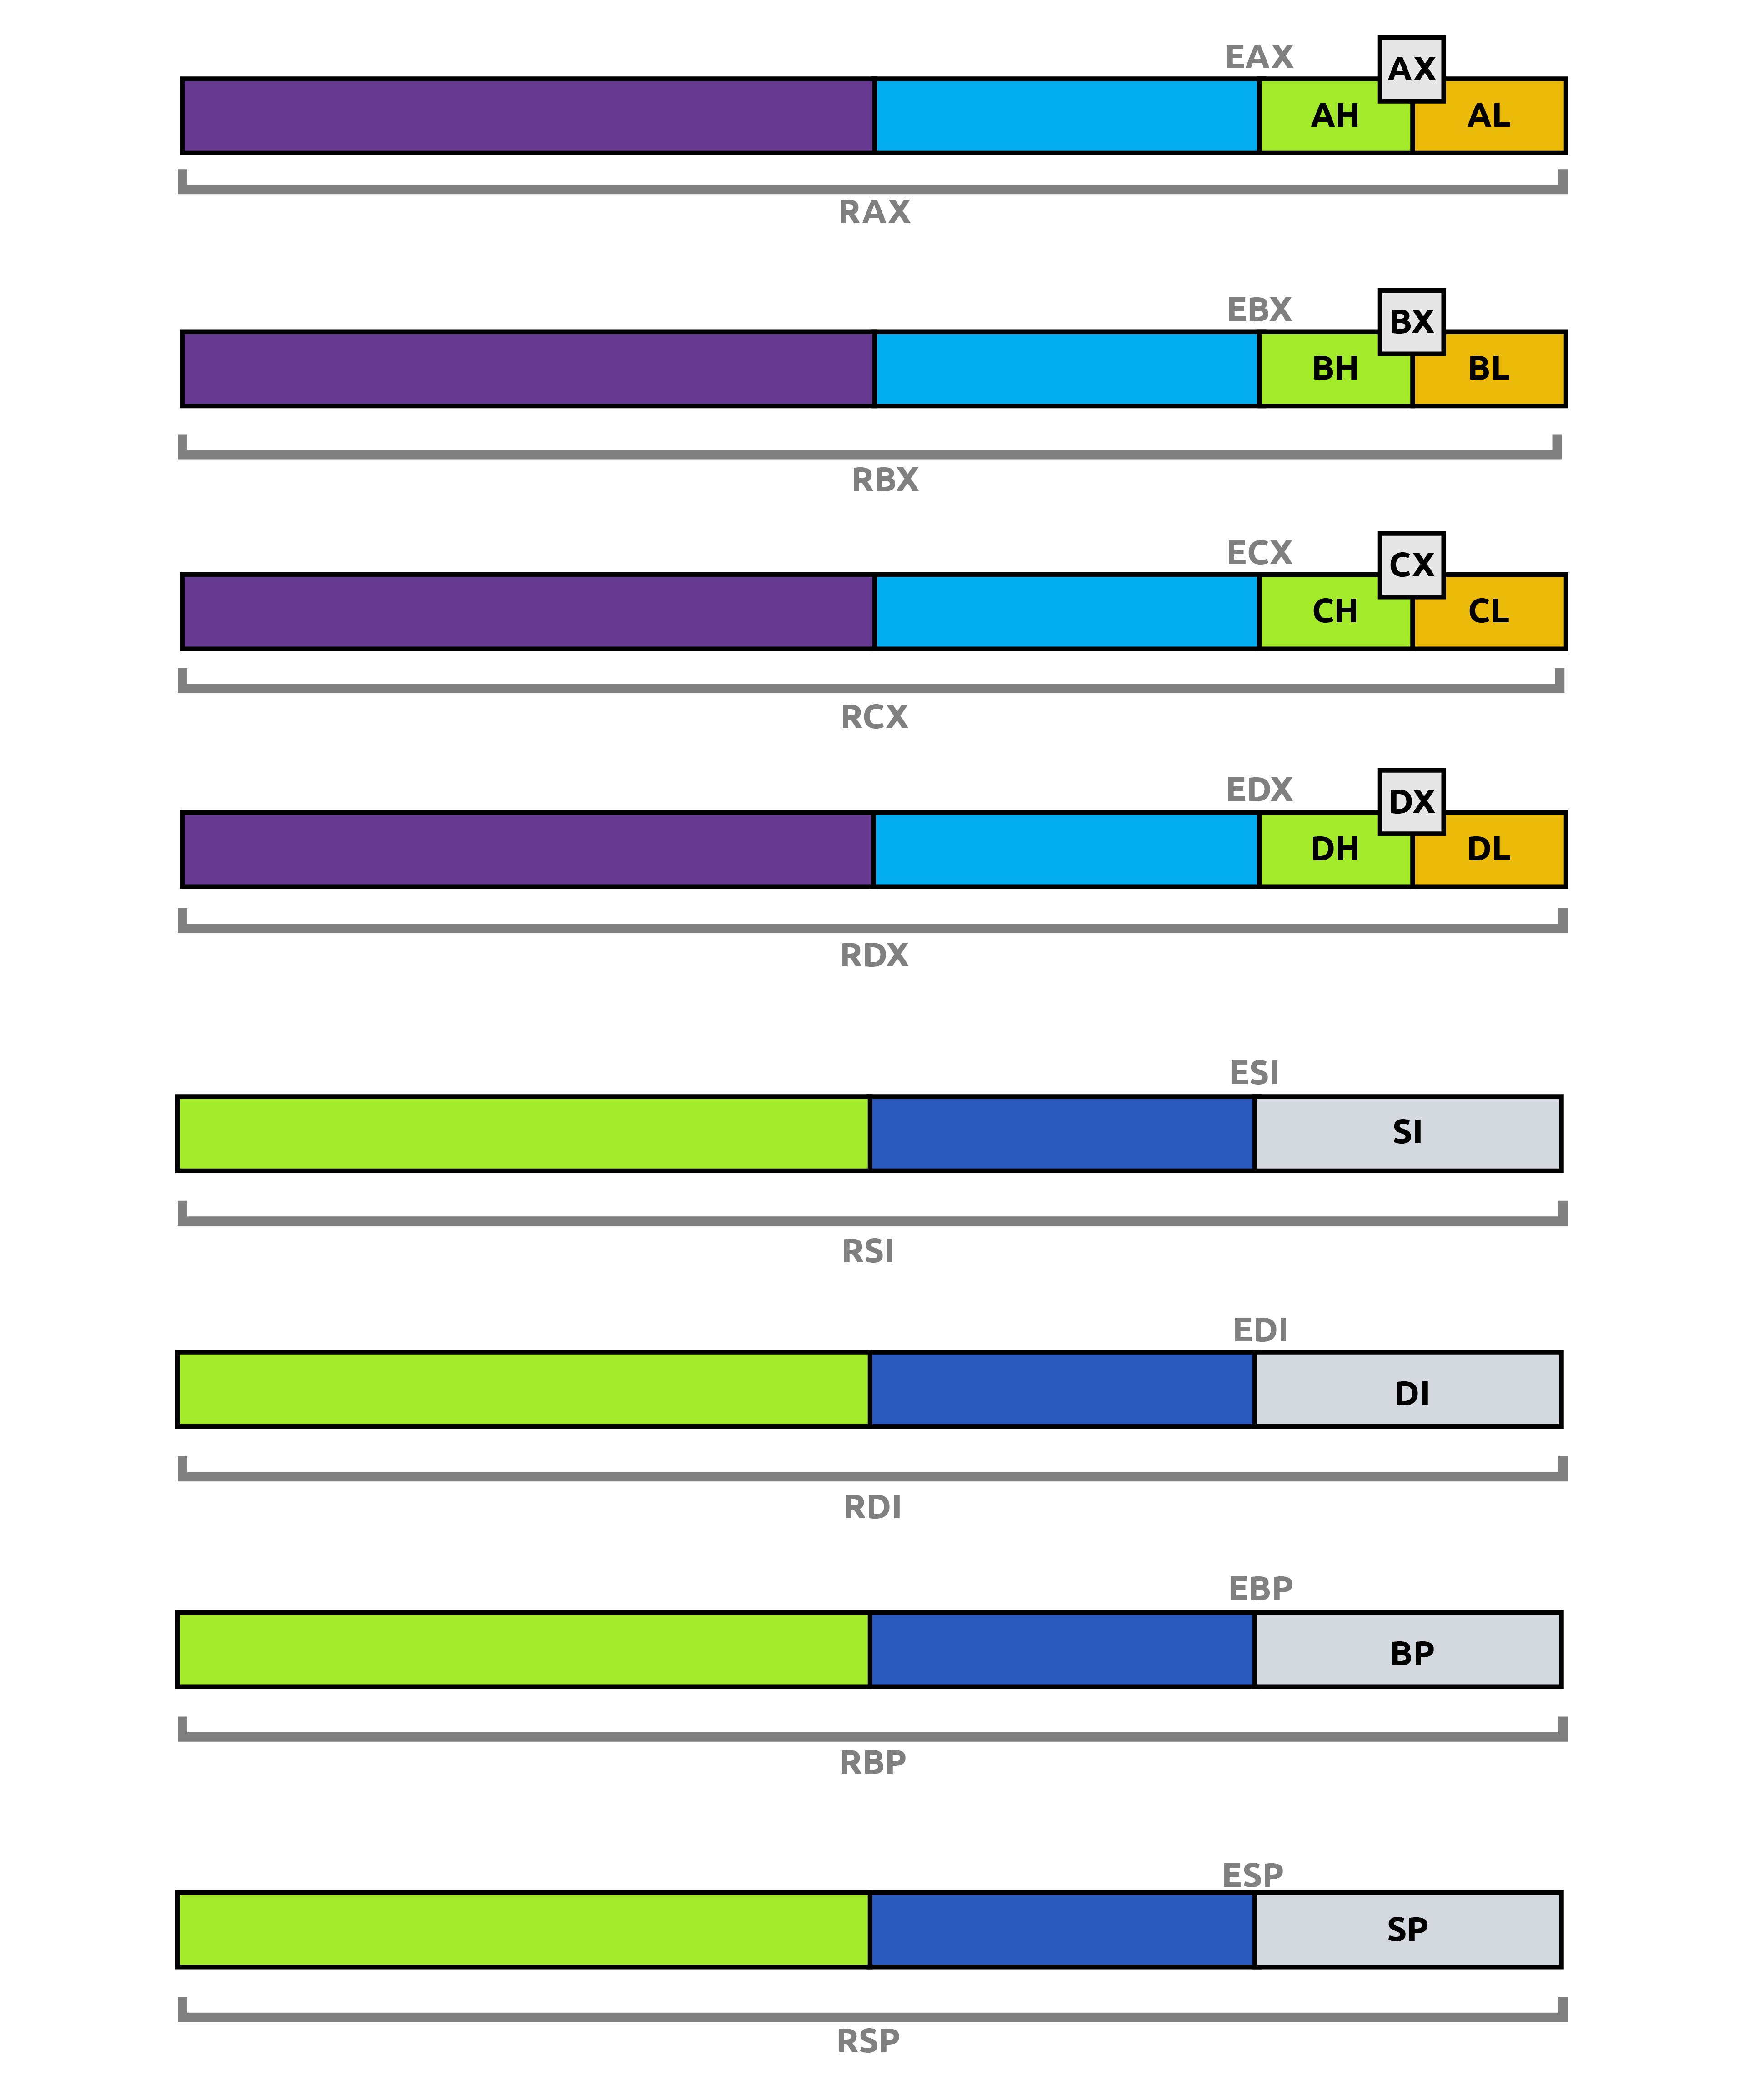
- As you will see below, each register has a ‘E’ version and an ‘R’ version. ‘E’ means it is for 32-bit, and ‘R’ means it is for 64-bit
- General Purpose Registers (32-bit registers in 32-bit systems and 64-bit registers in 64-bit systems)
- EAX/RAX: Accumulator, results of arithmetic operations are stored here.
- EBX/RBX: Base register, often used to store base address for referencing an offset.
- ECX/RCX: Counter, often used in counting operations such as loops.
- EDX/RDX: Data, often used in multiplication/division operations.
- ESP/RSP: Stack Pointer, points to the top of the stack
- EBP/RBP: Base Pointer, used to access parameters passed by the stack.
- ESI/RSI: Source Index register, used for string operations.
- EDI/RDI: Destination Index register, also used for string operations.
- R8-R15: Only in 64-bit systems, extra registers.
As you will see in the image below, some registers can be addressed by their 16-bit or even 8-bit counterparts, that target those specific lower bits alone. So for example, to access the lower 8-bits of RAX, you would use AL register.
Register - Flags
To indicate the status of execution of some operations, flags are used. EFLAGS, which is a single 32-bit register in 32-bit systems and RFLAGS, which is a single 64-bit register in 64-bit systems, handle this. These registers contain individual single bit flags for different purposes.
- Zero Flag, ZF, indicates if the result of the last instruction was 0.
- 1 means yes, the result was 0.
- 0 means no, the result was not 0.
- Carry Flag, CF, indicates if the result of the last executed instruction was too big or too small that it had to be carried over.
- 1 means yes, too big.
- 0 means no, not too big.
- Sign Flag, SF, indicates if result of an operation was negative (Most Significant Bit (MSB) is set to 1).
- 1 means yes, MSB is 1, negative.
- 0 means no, MSB is not 1, not negative.
- Trap Flag, TF, indicates if processor is running in debugging mode. Very useful for malware.
- It is important to note that this flag enables debugging, because it tells the CPU to stop after every instruction.
- You can find below in another section, how malware could exploit the trap flag.
Memory Overview
- When a program is loaded into the main memory, it doesn’t have access to see the entire system memory, but rather only has an abstracted view, whatever it needs (similar to the concept of least privilege to make more sense, the absolute basics of what is required to function).
- Main memory is divided into four sections:
- Code: Contains program code. .text section. This section has execute permissions because whatever is here needs to be executed.
- Data: Initialized data that is not variable, but constant. .data section.
- Heap: Dynamic memory, contains variables and data created and destroyed during program execution. Memory is used and freed based on variable creation and deletion.
- Stack: Contains local variables, arguments passed to the program, return address of parent program.
- Often targeted because control flow is handled through this section, and thus very valuable.
Stack Layout
- Last In, First Out (LIFO) Mechansim: Whatever came in last, is to be the one that goes out first.
- If you put A, B and C, in that order in a stack, when you take them out, you would get C, B and A, in that order.
- The CPU uses the Stack Pointer and the Base Pointer to keep track of the stack.
- The stack pointer (ESP or RSP) points to the top of the stack, which changes constantly when new elements come in (push), or existing elements go out (pop).
What Happens When a Function Is Called?
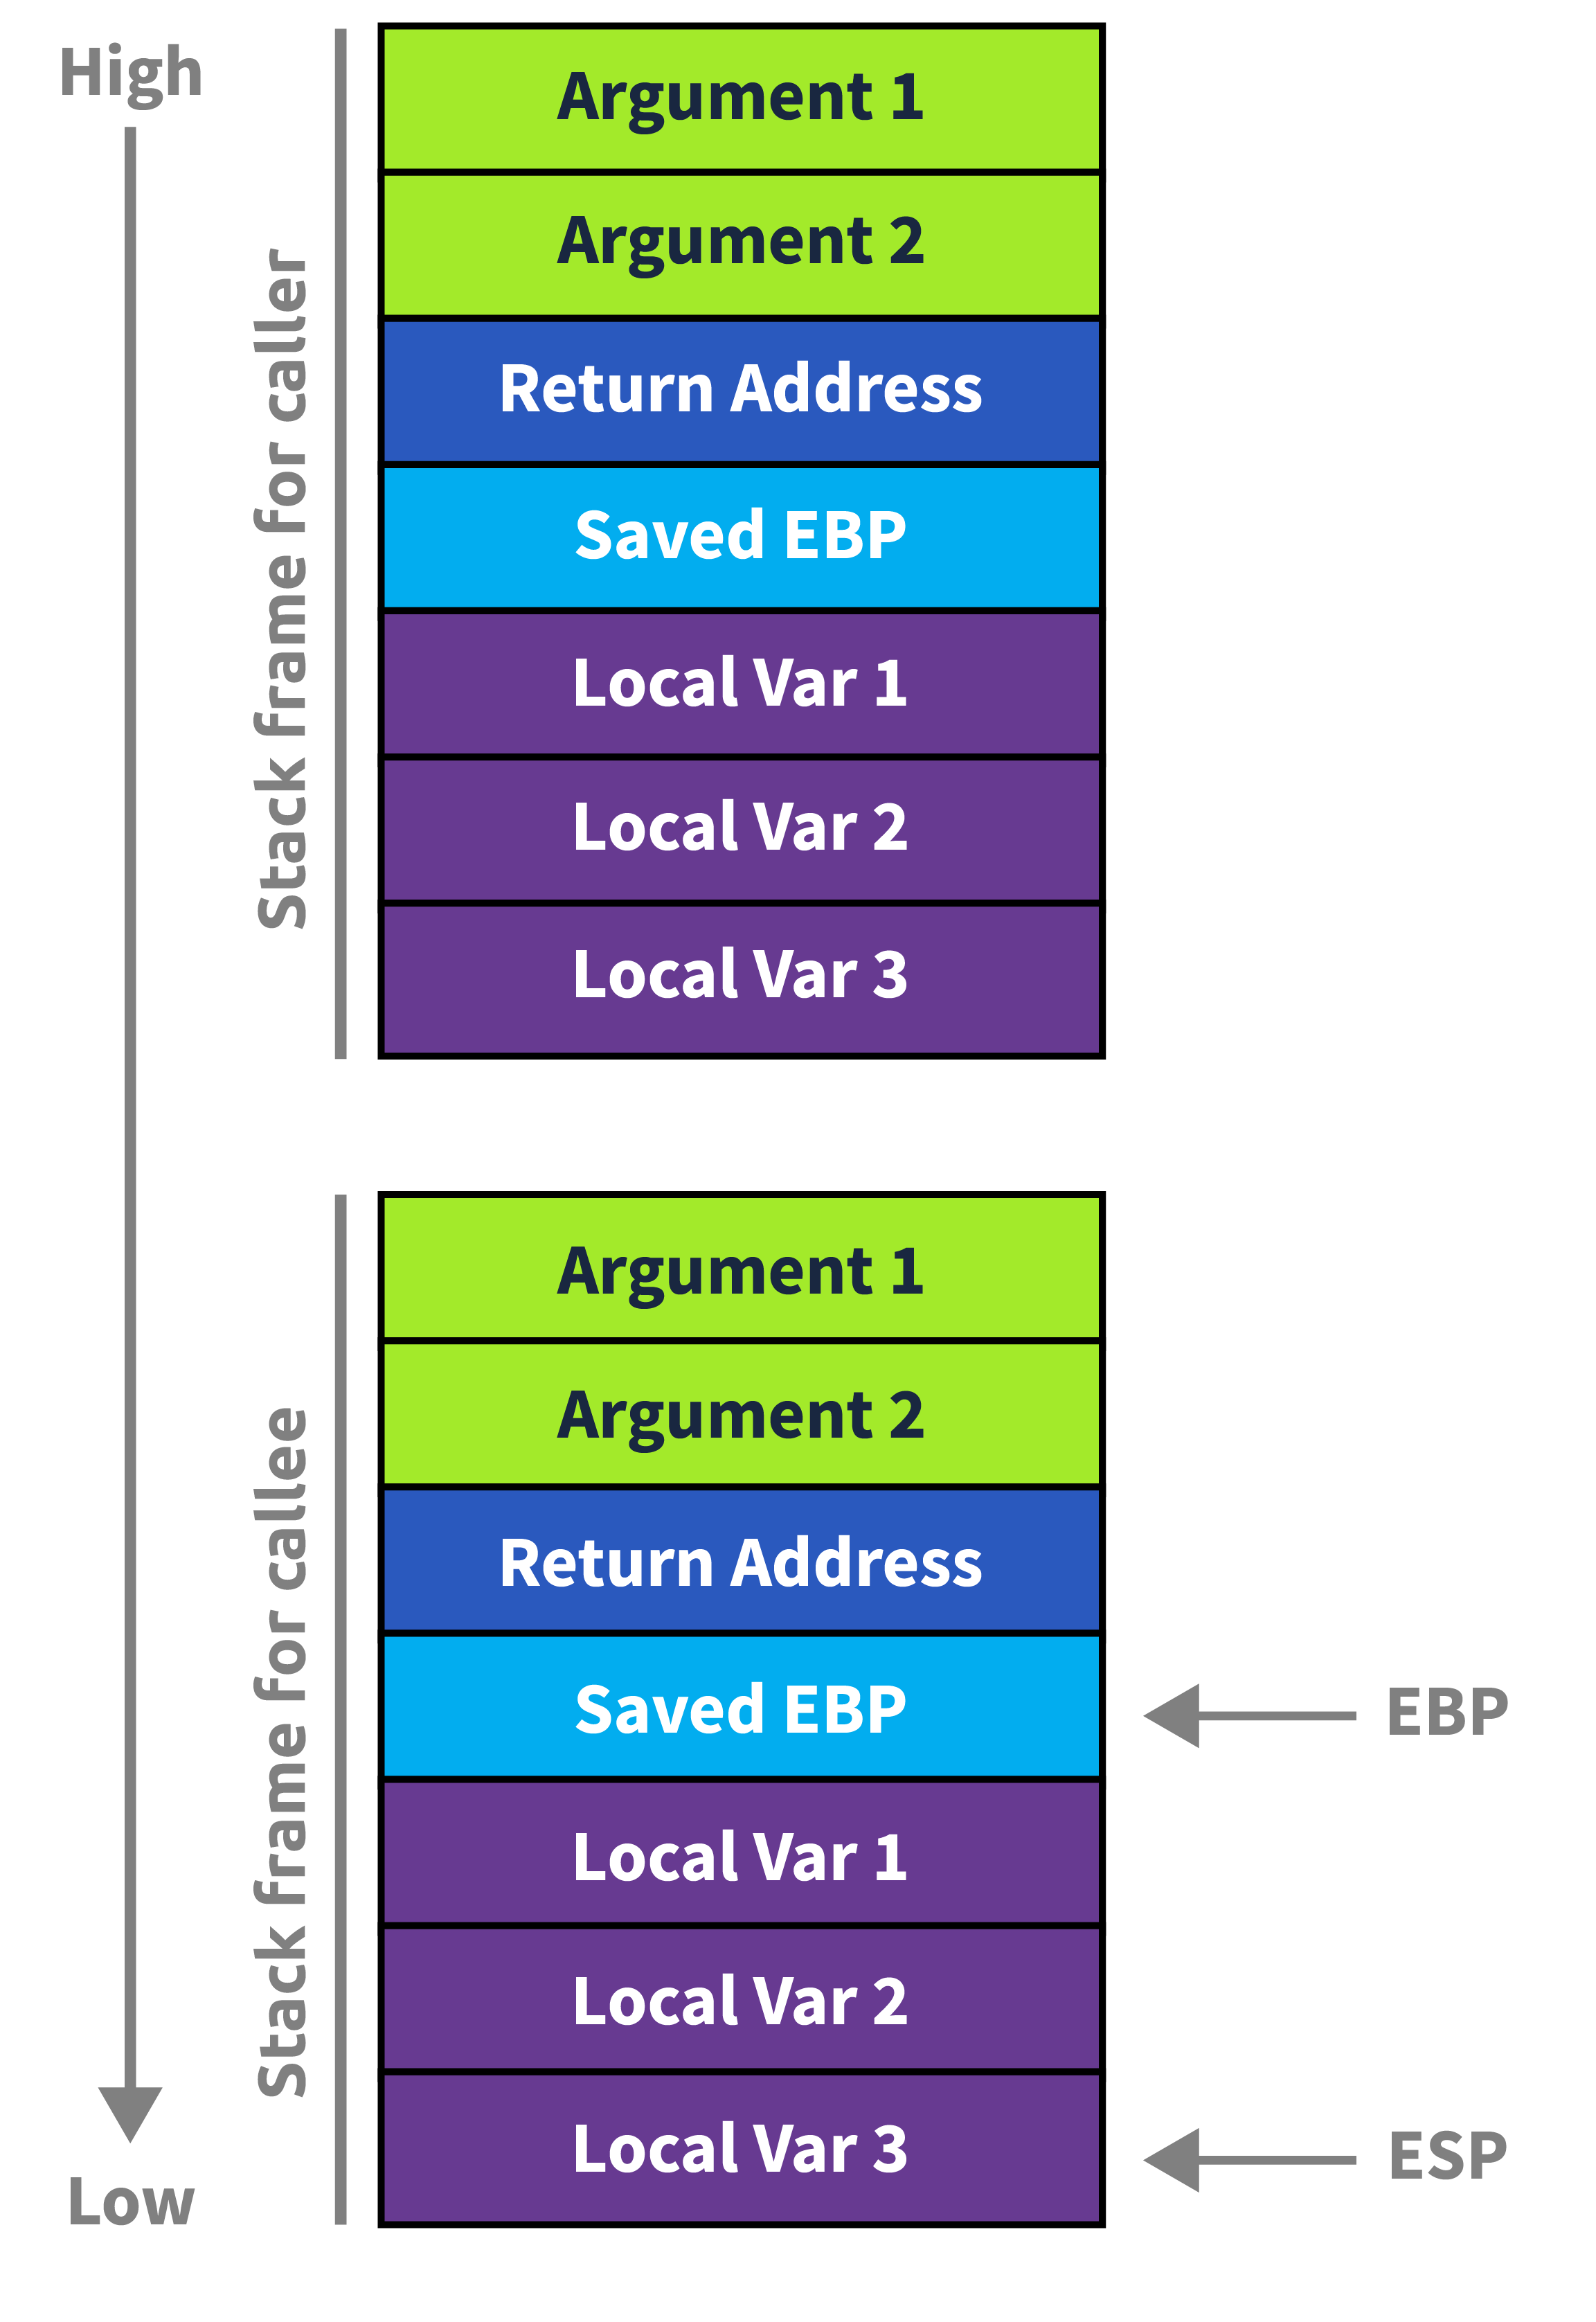
When your program calls a function, the CPU and compiler cooperate to build a stack frame — a structured slot on the stack for that call.
Step-by-Step
1. Arguments are pushed / placed in registers On x64 (Windows), the first 4 args go in RCX, RDX, R8, R9. Extras spill onto the stack.
2. The return address is pushed The CPU CALL instruction automatically pushes the address of the next instruction so execution can resume after the function returns.
3. The old base pointer is saved The callee saves the caller’s RBP so the caller’s frame can be restored.
4. A new frame is established RBP is set to the current RSP, and RSP is decremented to make room for local variables.
Stack Layout During a Call
1
2
3
4
5
6
7
8
9
10
11
12
13
14
15
High Addresses
┌─────────────────────────┐
│    Caller's Frame       │
├─────────────────────────┤
│    Function Arguments   │  (if stack-spilled)
├─────────────────────────┤
│    Return Address       │  ← pushed by CALL
├─────────────────────────┤
│    Saved RBP            │  ← pushed by callee prologue
├─────────────────────────┤
│    Local Variable A     │
│    Local Variable B     │  ← RSP points here (or below)
│         ...             │
└─────────────────────────┘
Low Addresses  (stack grows this way ↓)
The below notes are a little more complex, and not basics, but just something interesting about the Trap Flag.
How Malware Exploits the Trap Flag
1. Single-Step Detection via POPFD
Malware manually sets TF and installs its own exception handler via SetUnhandledExceptionFilter or an SEH chain. Under normal execution, the handler fires. Under a debugger, the debugger intercepts the single-step exception first and may not pass it to the program.
push offset my_handler
call SetUnhandledExceptionFilter

pushfd          ; Push EFLAGS onto stack
or dword [esp], 0x100  ; Set bit 8 (Trap Flag)
popfd           ; Restore EFLAGS with TF set
nop             ; <- Single-step exception fires HERE if no debugger
; If we reach here normally, handler ran -> not being debugged
; If debugger swallowed the exception -> detected
2. INT 1 / ICEBP Instruction Abuse
The undocumented INT 1 (opcode 0xF1) raises a debug exception directly. Malware checks whether its own handler receives it, or whether the debugger does.
xor eax, eax
int 1           ; Fires #DB — does our SEH/VEH handler get it?
test eax, eax   ; Handler sets EAX=1 if it ran
jz  debugger_detected
3. RDTSC Timing + Single-Step Overhead
Combine TF with RDTSC timing. Single-stepping under a debugger is orders of magnitude slower than native execution. Malware measures the delta:
rdtsc
mov [t1], eax

pushfd
or dword [esp], 0x100
popfd
nop             ; Single-step exception

rdtsc
sub eax, [t1]
cmp eax, 0x1000 ; Threshold — debugger will blow past this
ja  debugger_detected
4. VEH (Vectored Exception Handler) Race
In 64-bit Windows, malware registers a Vectored Exception Handler. Debuggers like x64dbg/WinDbg receive EXCEPTION_SINGLE_STEP first. The VEH checks whether the handler’s ExceptionRecord->ExceptionCode ever arrives — if not, a debugger is present.
5. Chained SEH Corruption Check
Malware deliberately walks the SEH chain under a single-step context. Debuggers sometimes modify or flatten SEH chains, making their tampering detectable.
Why This Works Against Debuggers
| Scenario | Without Debugger | With Debugger |
|---|---|---|
| TF exception | Goes to program’s SEH/VEH | Debugger intercepts first |
INT 1 | Program handler fires | Debugger may consume it |
| Timing delta | ~few cycles | Thousands of cycles |
| SEH chain | Intact | May be modified |
Mitigations & Countermeasures
For Analysts / Reverse Engineers
| Technique | Tool / Method |
|---|---|
| Pass exceptions to the program | In x64dbg: Shift+F9 passes exception to handler; configure “ignore single-step exceptions” |
| Plugin-based TF hiding | ScyllaHide, TitanHide — kernel-level plugins that patch EFLAGS inspection and spoof exception delivery |
| Emulation-based analysis | Use an emulator (e.g., Qiling, Unicorn Engine) — TF has no real meaning in emulation |
| Snapshot + full-system emulation | QEMU or Bochs with full CPU emulation; malware cannot distinguish hardware behavior |
| Patch the check statically | IDA/Ghidra — NOP out the popfd/TF-setting block before running |
| Time spoofing | Hook RDTSC via plugins or hypervisor to return consistent values |
At the OS / Platform Level
| Mitigation | Detail |
|---|---|
Kernel debugger (KD) | Operates at ring 0, below where most TF tricks operate; harder for usermode malware to detect |
| Hypervisor-based debugging | VMware/VirtualBox with stealth settings; or purpose-built tools like hvdebug operate below the guest OS |
NtSetInformationThread (HideFromDebugger) | Ironically, defenders can use this flag legitimately to reason about what malware is querying |
| ETW / Kernel Telemetry | Detect malware querying EFLAGS or registering unusual VEH chains as behavioral signals in EDR |
ScyllaHide (Most Practical for Analysts)
ScyllaHide is the go-to x64dbg/OllyDbg plugin that specifically addresses TF-based tricks by:
- Intercepting
EXCEPTION_SINGLE_STEPand forwarding it to the target process - Spoofing
NtQueryInformationProcessresults - Hiding debug heap flags and PEB fields simultaneously