TryHackMe Aurora EDR
Disclaimer: This post contains my personal notes and methodology for the respective TryHackMe room. All the credits for the room and the lab environment go to the original creators at TryHackMe. Flags are not revealed to preserve the challenge for others.
Objective
Aurora defines itself as a Custom Sigma-based Endpoint Agent. It uses Event Tracing for Windows.
We shall answer the following questions:
- What is an EDR?
- What is Event Tracing for Windows?
- What is Aurora? How does it work? ***
Endpoint Detection and Response (EDR)
EDR provides a proactive approach toward threat detection and visibility through near real-time monitoring of events on endpoints (host machines on a network, computers, laptops, smartphones, the devices used by people). Since this can be a daunting task when you take the number of devices and how complex they are into account, an EDR makes it easier through automation.
An EDR:
- Monitors and collects activity data from endpoints.
- Analyzes data to identify threat patterns.
- Can automatically respond to threats, isolate/contain them, eradicate them altogether, or in most cases, identify the appropriate personnel, based on their configurations.
- Can function as a forensic analysis tool, to research identified threats and search for suspicious activities in an endpoint device.
The storage of data collected on endpoints could be stored in endpoints, in centralized servers, or in a hybrid approach, covering both.
In general, EDRs can
- Detect threats
- Respond/Contain threats
- Integrate data from multiple endpoints, which helps in further investigation and identifying patterns
- Provide insights due to near real-time monitoring
- Perform in-depth investigation and forensics, outlining threat timelines and identifying threats that may go undetected otherwise.
Event Tracing for Windows (ETW)
This is a Windows OS logging feature that allows logging events raised by user-mode applications and kernel-mode drivers. ETW is the one that provides capability for applications and drivers to write events.
“Normal” Windows Event Logging is built on top of ETW, it’s a consumer of ETW events.
ETW allows logging detailed diagnostic and performance events with minimal overhead. It is this minimal overhead that allows its usage for real-time monitoring, something we need in an EDR.
ETW is made of three parts:
- Providers: Components (The OS, drivers, apps) that emit events. They have to register with the ETW Subsystem to send event information.
- Controllers: Tools that can start/stop trace sessions and configure which providers to listen to.
logmanorxperfor Windows Performance Recorder
- Consumers: Tools or Processes that read and process the event stream in real-time or from a saved
.etlfile.tracerptto view the events
Compared to Windows Event Logging, ETW writes to Kernel-managed ring buffers in memory, and can also trace kernel internals, providing deep insight into the endpoint system.
Aurora
Aurora is a Windows endpoint agent that uses Sigma rules and IOCs to detect threat patterns on local event streams using ETW. When a match is found, response actions are triggered, and displayed under Windows Event Log Viewer.
Aurora uses the Sigma rule set, highly customizable, and designed such that no data leaves the network.
Aurora must be excluded from any running antivirus or EDR solution, to avoid being blocked from executing its services.
Aurora can be set to work in four different preset configuration formats:
- Standard: Covers events at medium level severity.
- CPU Cap of Aurora agent is 35%. Balances coverage with stability well.
- Triggers alerts from medium level severity Sigma rules.
- Reduced/Minimal: Covers events at a high minimum reporting level.
- Minimal works at 20% CPU cap, where only high/critical severity Sigma rules triggers alerts. Most ETW sources are disabled.
- Reduced works at 30% CPU cap, with slightly more ETW sources, but still only reports on high/critical severity Sigma rules.
- Intense: Covers events at a low minimum reporting level.
- Maximum detection coverage with no CPU cap (100%). Uses the most system resources.
- Only for use in select systems, where maximum detection is required.
- Even low severity sigma rules will trigger alerts
Running Aurora
Since we are in windows
C:\Program Files\Aurora-Agent>aurora-agent.exe -c agent-config-minimal.yml
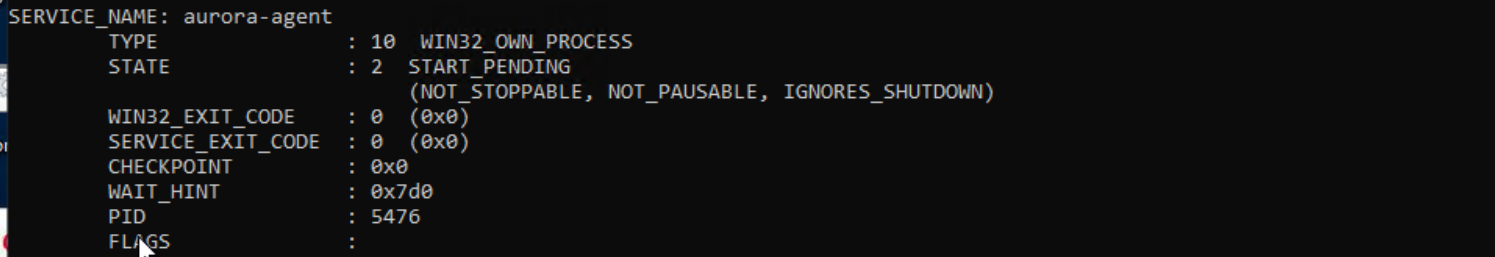
To run the Aurora agent as a service, we can use the flag --install
C:\Program Files\Aurora-Agent>aurora-agent.exe --install -c agent-config-minimal.yml
Some useful flags
--status- Provides information on the version, the uptime, rule statistics, sigma matches, missed events etc.
--trace- Queries all events Aurora monitors from the subscribed channels
C:\Program Files\Aurora-Agent>aurora-agent.exe --trace > aurora-trace.log
--json- Output in JSON.
Output options
- By default, you can use Windows Event Viewer to view Aurora’s events that it writes using ETW. Windows Logs -> Application -> Source: AuroraAgent.
--logfile, to create and write events to a logfile you specifyUDP/TCPtargets, flags:--udp-targetand--tcp-target.
Aurora Responses
Responses can be used to set specific actions to be performed and respond when an event matches.
Responses available by default:
- Suspend: Used to stop a specified process.
- Kill: Used to kill a specified process.
- Dump: Used to create a dump file found in the dump-path folder.
You can also set custom responses, by calling an internal program, which must be available from PATH
Custom responses have an additional set of flags that are used to modify and relay different types of information:
- Simulate, to test out rules
- Recursive, response will affect child processes (or grand-child. Any descendant process actually)
- Low privilege only,
lowprivonly, where responses trigger for low privilege accounts - Ancestor, response affects parent or grand parent process, not itself
- Process ID field, specify process to be affected by response.
Responses follow the template:
1
2
3
4
response:
    type: predefined / custom
    action: (suspend/kill/dump) / (custom command)
    ..further fields
Aurora EDR Event IDs
You can find a good list here: List of Event IDs, Aurora Agent Documentation
Still, some of the important ones are listed here for quick reference:
Sigma-Related Event IDs
These fire when a Sigma rule matches a specific event type.
| Event ID | Description | Category | Notes |
|---|---|---|---|
| 1 | Process creation Sigma rule matched | Sigma | Core detection — process spawning activity |
| 2 | Set file creation time Sigma rule matched | Sigma | Timestomping detection |
| 3 | Network connection Sigma rule matched | Sigma | C2 / lateral movement detection |
| 4 | Sysmon status Sigma rule matched | Sigma | Sysmon-sourced event match |
| 5 | Process termination Sigma rule matched | Sigma | Suspicious process exit behaviour |
| 6 | Driver loaded Sigma rule matched | Sigma | Kernel driver load — rootkit/BYOVD detection |
| 7 | Image loaded Sigma rule matched | Sigma | DLL/module load detection |
| 8 | Create remote thread Sigma rule matched | Sigma | Code injection technique detection |
| 9 | Raw disk access Sigma rule matched | Sigma | Direct disk reads bypassing filesystem |
| 10 | Process access Sigma rule matched | Sigma | LSASS/credential dumping detection |
| 11 | File creation Sigma rule matched | Sigma | Malware drop / suspicious file write |
| 12 | Registry event Sigma rule matched | Sigma | Registry modification detection |
| 13 | Create stream hash Sigma rule matched | Sigma | Alternate Data Stream (ADS) activity |
| 14 | Pipe event Sigma rule matched | Sigma | Named pipe creation/connection (e.g. C2 frameworks) |
| 15 | WMI event Sigma rule matched | Sigma | WMI persistence / lateral movement |
| 16 | Registry event Sigma rule matched (2nd type) | Sigma | Covers additional registry event subtypes |
| 17 | DNS query Sigma rule matched | Sigma | DNS-based C2 / exfiltration detection |
Internal Event IDs
Operational and lifecycle events from the Aurora agent itself.
| Event ID | Description | Category | Notes |
|---|---|---|---|
| 100 | A license file was found | Internal | Startup licensing check passed |
| 101 | Status message (from –report-stats) | Internal | Periodic health/stats reporting |
| 102 | Aurora Agent started | Internal | Service startup confirmation |
| 103 | Aurora Agent is terminating | Internal | Service shutdown — watch for unexpected occurrences |
| 104 | Current license expired | Internal | Licensing issue — detections may stop |
| 105 | No valid license file was found | Internal | Agent may not apply private Sigma rules |
| 107 | A process generated a large number of events | Internal | Performance warning — noisy process identified |
| 108 | An internal panic occurred | Internal | Agent crash/error — requires investigation |
IDs 1, 3, 6, 7, 8, 10, 14, and 17 are the highest-signal events for threat detection.
Aurora Detection Gaps
Some events lack reliable ETW coverage, or produce events that may be too noisy to correlate.
1. Named Pipes
| Gap | Detail | Mitigation |
|---|---|---|
| No ETW provider for pipe creation/connection | ETW has no native provider that covers named pipe creation or connections — a core C2 technique (e.g. CobaltStrike) | Use Intense preset or supplement with Sysmon (Event ID 17) |
| Short-lived pipes missed by default | Aurora uses polling to detect open named pipes, but only catches pipes that exist for more than 10 seconds | Intense preset enables the noisy Kernel Object Handle provider which catches all handle open/close activity |
| Kernel Object Handle provider is very noisy | The only ETW method to observe pipe events generates excessive handle noise, making it impractical outside of Intense | Careful Sigma tuning required if enabling in Intense |
2. Registry Events
| Gap | Detail | Mitigation |
|---|---|---|
| Handle-based references make keys unresolvable | The Microsoft-Windows-Kernel-Registry ETW provider references keys by their handle, not by name — requiring all handles to be tracked to reconstruct full key paths | Only feasible in Intense preset due to CPU cost |
| Registry value data field is broken | The ETW manifest contains a field for the written data, but it appears empty — Aurora must re-read the registry after the event, which is inherently unreliable | No clean fix; value may have changed again by the time it’s read |
| Registry detection only active in Intense | Due to the CPU cost of handle tracking, registry rule matching is disabled in Standard, Reduced, and Minimal presets | Switch to Intense, or use Sysmon (Event IDs 12–14) alongside Aurora |
| OpenKey events missing BaseName | OpenKey ETW events show a relative name but the BaseName field is empty, requiring correlation with prior OpenKey events to reconstruct the full path | Complex event correlation needed; not reliable in real time |
3. ETW Disabling (Attacker Evasion)
| Gap | Detail | Mitigation |
|---|---|---|
| Attackers can patch ETW syscalls | Since some ETW events originate from user space, an attacker can disable ETW from within their own process by patching the syscalls Windows uses to emit events — common in offensive frameworks | Aurora’s full version includes the ETW Canary module (Event ID 400) which detects ETW manipulation |
| User-space providers are untrusted | Any ETW provider not prefixed with Microsoft-Windows-Kernel can be suppressed by a malicious process and should be treated with lower confidence in detection rules | Prioritise kernel-space ETW providers in rule writing |
4. Handle Polling & Asynchronous Handles
| Gap | Detail | Mitigation |
|---|---|---|
| Asynchronous handle events may be missed | Some handles are opened and closed asynchronously, meaning Aurora’s polling interval may not capture them | Intense preset reduces this gap but does not eliminate it |
| Polling is not event-driven | Unlike true ETW callbacks, Aurora’s handle polling is interval-based — meaning very brief or transient activity between poll cycles can be invisible | No full mitigation; accept as a visibility limitation |
Summary: Recommended Mitigations
| Gap Area | Fix |
|---|---|
| Named pipes | Deploy Sysmon alongside Aurora with Nextron’s recommended Sysmon config |
| Registry events | Use Intense preset on high-value targets; use Sysmon on standard endpoints |
| ETW disabling | Ensure Aurora full version (not Lite) is deployed — ETW Canary module required |
| Short-lived activity | Accept residual gap; focus detection on persistence and post-exploitation behaviours |
Interactive Scenario
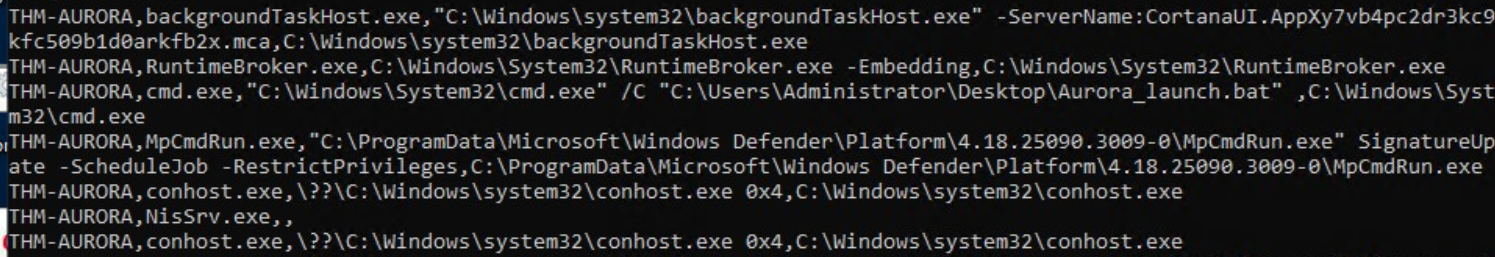
Recently, a series of suspicious activities have been observed within THM_Acme’s systems. The CISO has recently heard about Aurora and has tasked you to carry out tests on one of the Windows hosts and assess its detection capabilities. Aurora has been installed on the Windows host. However, it is not running. Execute the batch file attached on the Desktop to launch and investigate any produced events starting with Event ID: 1 associated with Aurora.
- In the Desktop, we find
Aurora_launcher.bat. Run it one to two times. - Keep Windows Event Viewer open, with Windows Logs -> Application tab
- Filter Current Log for Event ID 1
- Wait till you see some logs with source AuroraAgent.
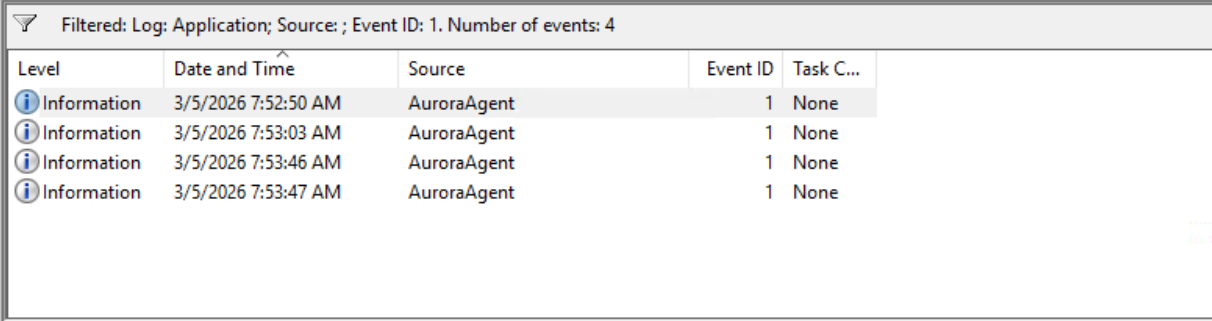
The tasks are pretty simple, you just have to go through the logs and find the title, the sigma rule level, rule ID etc.
Key Takeaways
Aurora is not supposed to be a replacement for other EDRs. Nextron built it for a specific audience: threat hunters, detection engineers, and incident responders who want to run their own detection logic on endpoints without being locked into a vendor’s black-box ruleset. Custom detection is its strongest suit. It is also very lightweight, less resource hungry (At standard preset) than a full commercial EDR stack.
Other commercial EDR stacks provide better SIEM integration, better automated remediation, cloud-based threat intel feeds etc. So Aurora EDR must be viewed as Complementary or Specialist tool.